EUR/USD
The EURUSD is everyone’s favorite and most liquid forex pair, famous for having tight spreads. However, it is one of the most volatile pairs in the FX market. Investors can place trades to capitalize on the EUR/USD’s exchange rate while using the pair’s live chart to perform technical analysis before trading.
After going through this guide, you will gain a comprehensive understanding of the EURUSD price and the daily fluctuations in its exchange rate. You will be equipped with the knowledge to conduct technical analysis on the pair and grasp the methodologies analysts employ to create accurate price forecasts. Additionally, you will receive invaluable educational tips on trading the pair, including optimal trading hours. Furthermore, you will gain a stronger grasp on utilizing historical data to make informed trading decisions. Lastly, we will address the most commonly asked questions to ensure all your queries are answered.
EUR USD live chart
The EUR/USD is a symbol that refers to the Euro against the U.S. dollar currency pair. The value of the Euro against the dollar is quoted as 1 Euro x U.S dollars. The average exchange rate for the EUR/USD pair sits at approximately 1.15 dollars to buy 1 Euro.
It is the most widely traded pair because the Euro-Zone and the United States are two of the largest and most influential economies globally. Even though the euro is used across most European countries, it is also important to note the commanding power of the central banks of these two major economies and their ability to impact other foreign currencies significantly.
The price chart below represents the EURUSD exchange rate live chart.
Learn more about EURUSD trading accounts and product specifications.
EUR USD forecast
The EURUSD forecast predicts that the currency pair shall trade in a specific direction in the future. Such forecasts answer the question, where is EURUSD going? Traders can take advantage of such forecasts to place trades in the most probable future direction.
For example, the EUR/USD dropped below the 1.16 level after the European Central Bank monetary policy statement was released in late October 2021. This is because the ECB decided to leave monetary policy unchanged despite inflation jumping to a 13 year high. As a result, the Eurozone CPI figure increased to 4.1% in October from 3.4% in September.
Shrugging off concerns that the spikes in inflation are transitory. The EUR USD forecast long term indicates that the currency pair will stay in the 1.16 trading range till the end of Q1 2022r unless it breaks the 1.15 handle, where it could witness a sharp selloff. The EUR USD forecast 2022 by strategists from Danske Bank is that the pair will fall to 1.10 by the end of the year. The move could be driven by the ECB’s inability to control inflation and its hesitancy to act.
Other factors weighing on the highly liquid FX pair also affect the world, such as the microchip supply chain issues, affecting multiple economic indicators and pressuring the Euro. Therefore, the EURUSD long term forecast will remain vulnerable to 1.17. Investor sentiment also indicates more short positions than long ones, but the bottom line remains mixed.
Traders have started to price in the November 3rd Federal Reserve meeting and are adjusting their positions with expectations of a hawkish tone toward tapering asset purchases. As a result, the USD has been climbing higher, and retail sales from the Euro-Zone countries like Germany have also pressured the Euro, capping gains after its retail sales contracted by 2.5%.
Today’s EUR/USD forecast will remain bearish, especially given the thin trading volumes ahead of the much anticipated Federal Reserve meeting.
What affects the EUR USD exchange rate?

1. Single currency strength or weakness.
The EUR/USD exchange rate can increase or decrease according to the Euro’s and US dollar’s strength or weakness.
2. Central bank monetary policy changes.
A move by either of the two central banks to change interest rates or a general intervention to strengthen their base currencies would lead to the decline of the opposing currency. For example, if the US Federal Reserve Bank intervenes by raising interest rates to make the dollar stronger, investors will notice a decline in the EUR/USD rate.
3. Fundamental News
Geopolitics, economic crisis, economic and natural disasters, or inflation can significantly impact currencies.
EUR USD technical analysis
At the time of writing (28 October 2021), the EURUSD technical analysis came ahead of the month’s European Central Bank’s monetary policy meeting.
EUR/USD
Support levels: 1.157,1.15,1.1544
Resistance levels: 1.1663,1.1695,1.18

Pullback strategy
Traders use the pullback strategy to buy and sell the EUR/USD currency pair because of its strong momentum. This strategy takes advantage of opportunities within the trend, but traders could lose money if the price reverses (in the long term).
A pullback often occurs before an uptrend resumes, and traders can use this to open a position, assuming that the asset will continue its uptrend. Pullbacks are usually applied to short-term price declines in an uptrend.
Key pivot points and critical levels can be identified using different indicators such as the moving average or Fibonacci retracements, which can help traders initiate a successful trade. Traders need to be careful not to mistake reversals for pullbacks. The difference is that reversals are longer-term and can be triggered by weaker than expected economic indicators, among other fundamental news.
Breakout strategy
Scalping
Scalping is a straightforward trading strategy that is suitable for both beginners and experienced traders. By using indicators such as the Relative Strength Index (RSI) or Bollinger Bands, traders can identify buy and sell signals. Additionally, visible signs of a change in direction can be observed as the price moves towards the opposite direction.
A critical analysis of any chart requires a deep dive into research and analyst expectations. There are many valuable resources available beyond online materials for identifying the trend direction of an asset. Using different technical indicators can also provide guidance on where the market is headed, giving at least a general idea.
EUR USD historical data
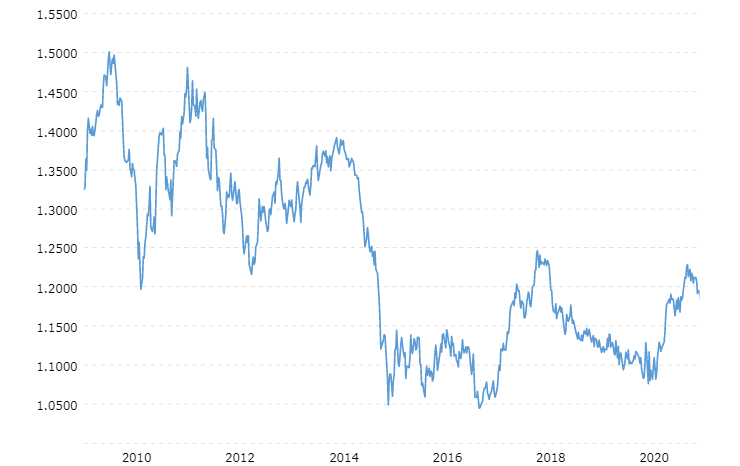
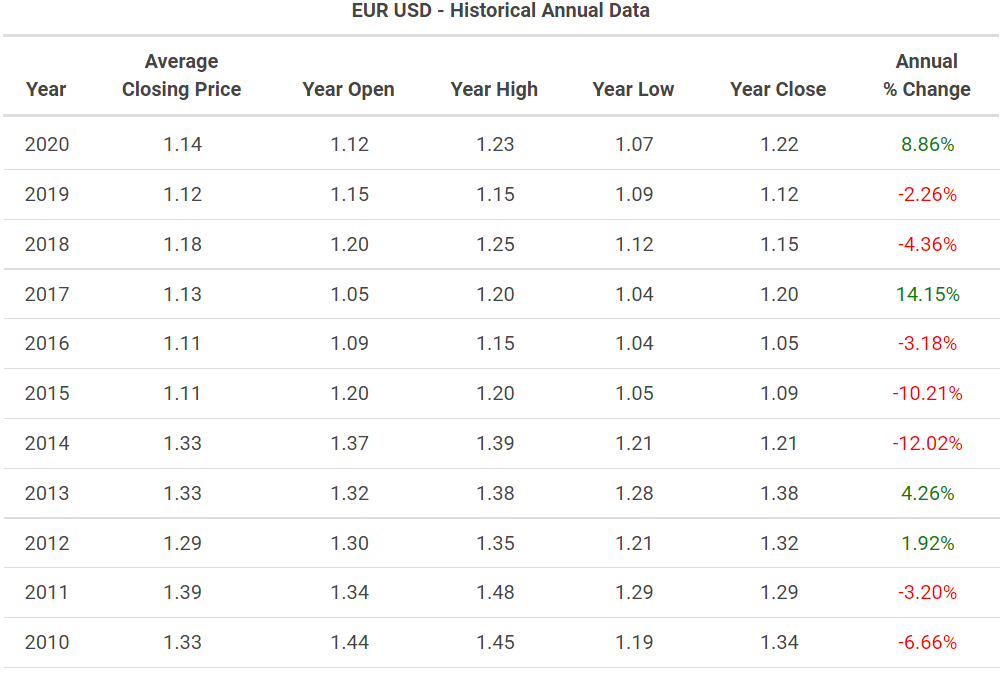
To accurately identify the price direction of any financial instrument, we need to study the historical patterns of the asset. In the next section, we will briefly skim through the history of EUR/USD prices to establish projections regarding future and current trends. The likelihood of this trend following the narrow range is expected to follow or continue its downtrend and trade below the 1.16 level.
Historical charts are highly valuable for technical analysis because financial instruments and commodities tend to repeat patterns seen in historical price action. However, the reliability of historical data may vary when trading the EUR/USD due to ever-changing financial news. Nevertheless, trends can be measured and provide an indication of where markets may be headed. Additionally, traders use historical patterns to identify the best entry and exit points.
The more familiar you become with past price patterns, the better you will be at recognizing them when they occur again. Historical price patterns influence current price action. They show you areas where breakouts have happened in the past and whether markets are genuinely bullish or bearish. Making trading decisions can be difficult, and your psychological state plays a significant role in your risk management. As a result, historical patterns can boost your confidence and give you a starting point.
According to the Euro/Dollar exchange rate historical chart, the EUR/USD average closing price was indicated below.
- 1.12 in 2019
- 1.14 in 2020
- 1.19 in 2021
EUR USD Trading hours
Three key market sessions allow you to trade whenever and wherever you are. The Asian, European, and American sessions are based on the Tokyo, London, and New York time zones.
New York – is between 01:00 pm to 10:00 pm GMT
London – is between 8:00 am to 5:00 pm GMT
Tokyo – is between 00:00 am to 9:00 am GMT
The best time to trade the EUR/USD is when news releases come out, particularly during the U.S. Session or when economic indicators are due, especially when a major central bank decision is anticipated. You will find that volatility increases during these hours.
How to trade or invest in the EURUSD like a pro - 3 simple steps
Register for an account
Open your account
Complete the Live Trading Account application form. Once we have verified identity and once you have passed our knowledge assessment, we will set up your account.
Fund your account
Start trading
ATFX offers several online trading services, spread betting (UK and Ireland clients only) and CFD trading. These are some of the most popular ways to trade instruments like forex, equity indices and commodities.

Why trade EURUSD with ATFX?
Competitive Spreads
24/5 Forex Trading
Trade 40+ Currency Pairs
Competitive Commission
Tight competitive commission – meaning you pay less to open a position.
FAQ
The sterling, 1 pound equals 1.18 Euro, and 1 Euro is 0.85 sterling.
The GBP/USD currency pair, otherwise known as 1 British Pound Sterling per X number of US Dollars, is the best example in terms of correlation. Whenever the EUR/USD trades upwards, GBP/USD moves in the same direction. When the correlation equals negative 1, the common observation is that two currency pairs will move in the opposite direction 100% of the time.
The Euro is currently in a downtrend, and the technical indicators show that the currency pair will stay in the 1.16 trading range till the end of this quarter unless it breaks the 1.15 handle where it could witness a sharp selloff.
For more details, refer to the EUR USD Forecast section above.
The GBP/USD is highly correlated with the EUR/USD; usually, you’ll find similar movements in both currency pairs.
The forex market is open 24 hours within different time zones, except on weekends.
Kindly refer to the Support and Resistance pivot points to identify signals in the technical analysis section.
The Euro is currently following a downtrend. Technical indicators designate that the currency pair will stay in the 1.16 trading range until the end of this quarter unless it breaks the 1.15 handle, where it could witness a sharp selloff.
For more details, refer to the EUR USD Forecast section
In 2008, The EUR/USD reached an all-time high of 1.6038.
You can use a EUR USD lot size calculator or ultimately the below formula;
Account Risk / (Trade Risk in pips x Pip Value) = Position size in lots
The EUR CoT stands for the commitment of traders’ reports, and it’s usually used to help the public understand market dynamics. So, for example, when the COT index rises, investors tend to be more bullish about the Euro.
Both assets have a negative correlation to the U.S. Dollar.
To calculate the value of a pip, you should divide 1/100 by the exchange rate.
For the EUR/USD: One pip is 1/100 divided by 1.160
The forex market is open 24 hours within different time zones, except on weekends.
The best time to trade EUR/USD is when news releases come out or when economic indicators come out and when a major central bank decision is anticipated. You will find volatility increases during these hours. The busiest time zone is between New York and London by volume.

EURUSD Has PMI Figures Ahead
The EURUSD exchange rate has high-level afternoon figures in the form of Eurozone and German PMI data. EURUSD is elevated above the highs from September-October

EURUSD Loses Ground To The US Dollar
The EURUSD exchange rate has seen a near-term pause in its rally after rate cut talk. EURUSD – Daily Chart EURUSD spiked to 1.110 but

EURUSD Bulls Are In Control After Post-Tariff Rally
The EURUSD exchange rate continued its bullish run with a post-tariff rally on Thursday. EURUSD – Daily Chart The latest surge in the euro drove

EURUSD On Six-Day Decline Streak As Tariff Fears Grow
EUR/USD declined by 0.26% on Wednesday, extending its losing streak to six consecutive sessions. The pair fell below 1.0750 for the first time since early