Fibonacci retracements are a vital technical analysis tool that can elevate trading strategy. Derived from the Fibonacci sequence, these retracement levels (23.6%, 38.2%, 50%, 61.8%, and 78.6%) help traders identify pivotal areas of support, resistance, potential reversals, and price pullbacks. The Golden Ratio (61.8%) serves as a solid mathematical foundation for making better trading decisions.
Rooted in the work of mathematician Leonardo Bonacci, also known as Fibonacci, these retracements have been widely adopted by modern analysts to predict market movements. When applied correctly, they allow traders to align their strategies with market conditions.
This guide explains Fibonacci retracements in simple terms and demonstrates how to use them effectively on platforms like MT4 / MT5 (MetaTrader4/MetaTrader5). In addition, it covers how to enhance trading precision with the Support & Resistance Indicator available on the ATFX trading platform.
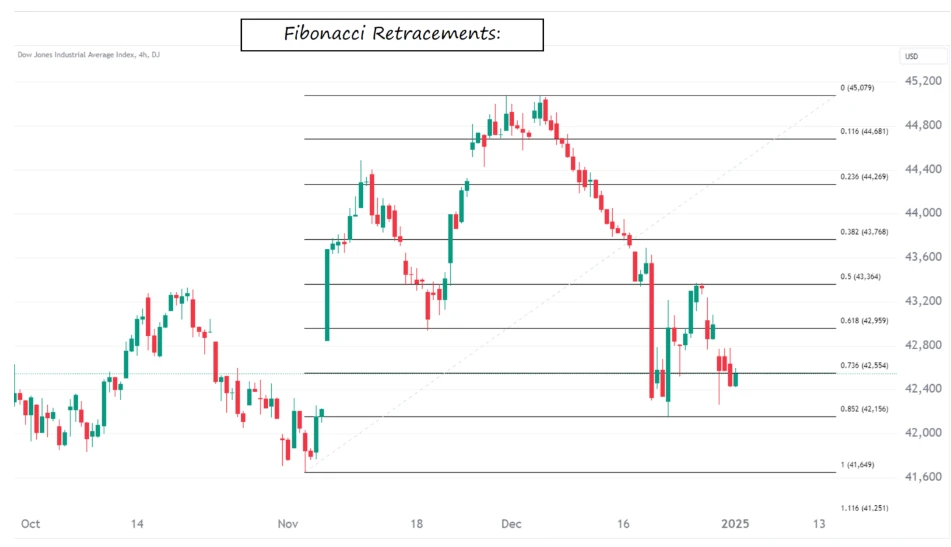
Explanation of Fibonacci Ratios:
23.6% (0.236) and 38.2% (0.382): Indicate relatively shallow pullbacks, often observed in strong trends.
50% (0.5): It is not a Fibonacci ratio. (though many use this level as if it was)
61.8% (0.618): The Golden Ratio is very important for finding reversals.
78.6% (0.786): Further retracements are more likely to culminate in central reversal.
How Fibonacci Retracements Work
Fibonacci Retracements show where prices might reverse or pivot after a move. Those levels usually transform into support and resistance zones, and they will also be much stronger together with other technical tools, such as the Support & Resistance Indicator in ATFX’s MT4 platform.

Steps to Draw Fibonacci Retracements
Find a Trend: Identify the high and low points of the trend to analyze.
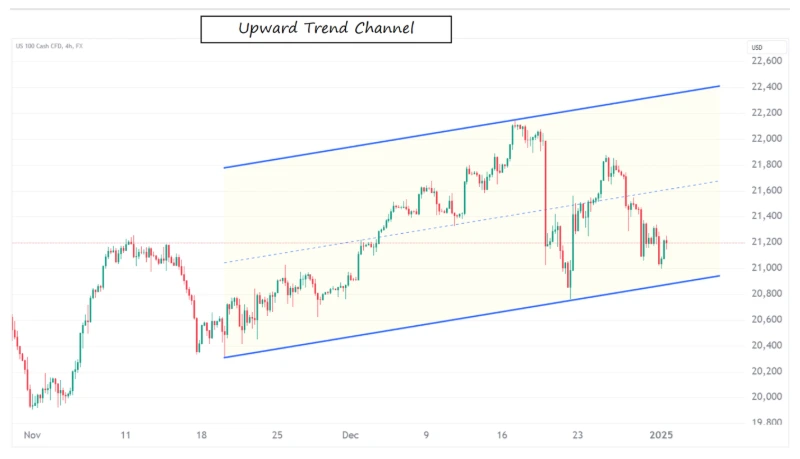
Uptrend: Draw a line from swing low (lowest price) to swing high (highest price).
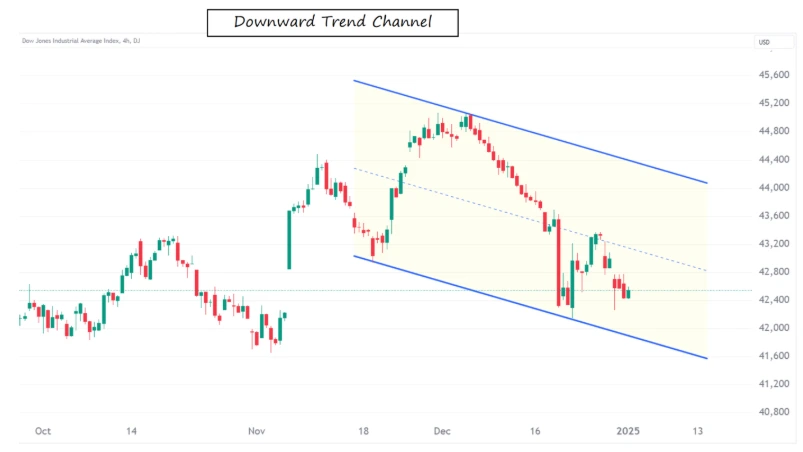
Downtrend: From highest price point (swing high) to lowest price point (swing low)
Use the Fibonacci Tool: Use the Fibonacci retracement tool on a trading platform and overlay the levels on the chart being analyzed.
Look for the Reversal Zone: See how prices act with the levels of support or resistance shown by the Fibonacci generally for a support in uptrend and resistance in downtrend.
How to Use Fibonacci Retracements in Trading Strategy
Fibonacci Retracements are fluid and work well with most trading systems. Here’s an example of how to use them:
I. Identifying Entry Points
Seek price recovery to key Fibonacci targets (i.e., 0.382 (38.2%) and 0.618 (61.8%) or so, etc) to start the trade when the main trend resumes again. Verifying those levels with ATFX’s support & resistance indicator which helps to confirm alignment with reversal zones.
II. Setting Stop-Loss and Take-Profit Levels
Stop-Loss: Adjust the stop-loss and take-profit levels to ensure the stop-loss is placed below the next Fibonacci level if the price does not reverse as anticipated.
Take-Profit: Use Fibonacci extensions (levels beyond 100%) to set profit targets, predicting where the price might move after breaking a retracement level.
III. Combining the Fibonacci Retracement with RSI
This strategy involves using Fibonacci Retracement levels to identify potential support and resistance, combined with RSl to gauge overbought or oversold conditions and volume to confirm breakouts.
In a bullish market, wait for the price to pull back to a Fibonacci level (e.g., 50%). lf RSl enters the oversold territory (below 30), this could indicate a buying opportunity
When using Fibonacci Retracements, supplement conclusions with moving averages, Relative Strength Index (RSI), or Candlestick Patterns.
Example: A bullish pattern occurring at 61.8% retracement in a bullish flag strengthens the buy signal.
IV. Spotting Reversals
Use Fibonacci Retracements to identify potential reversal zones. If the price fails to break through a key Fibonacci level, it’s likely to reverse direction.
Example of Fibonacci Retracements in Action
Each Fibonacci Retracement Level Explained:
23.6%: A minor pullback; the price may bounce quickly from here during strong trends.
38.2%: A moderate retracement, often seen as a strong support or resistance level.
50%: Though not an official Fibonacci number, traders widely use it to mark a halfway retracement.
61.8%: Known as the Golden Ratio, this is considered a strong area of potential reversal.
73.6%: Deep retracement; if the price holds here, a reversal is highly likely, but breaking this level might signal a trend change.
These levels help traders identify where a currency pair might reverse or pause during its movement. These levels help plan entries, exits, and stop-loss points more confidently.
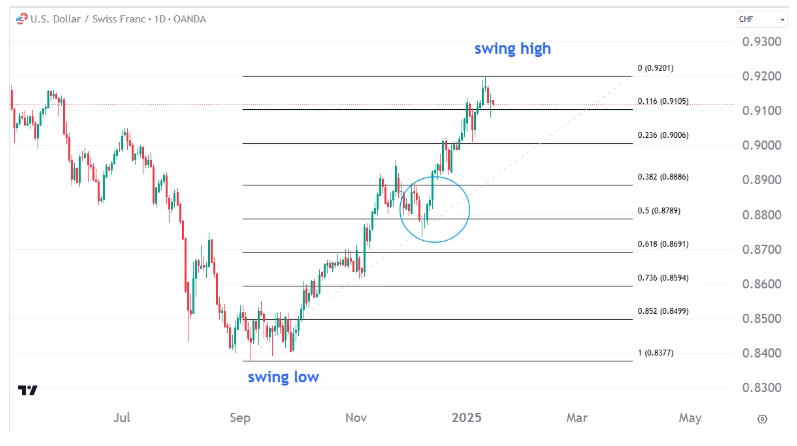
Example: Below is an example of USD/CHF in the period of 6 Sep 2024 to 13 Jan 2025 : Price goes from 0.8377 (swing low) to 0.9201 (swing high). We can use Fibonacci Retracement levels to spot those potential reversal spots. In an uptrend, wait for the price to retrace to a key Fibonacci level, such as 50% or 61.8%, it could be a potential reversal area, signaling a buying opportunity if it starts moving upward again.
Advantages of Fibonacci Retracements
Simple, Accessible and Easy to Use: This tool is popular across all trading platforms.
Versatile: Applicable to forex, stocks, commodities, and other financial instruments.
Enhances Decision-Making: This allows for clearer differentiation between profitable and potentially non-profitable setups with even greater certainty.
Common Mistakes to Avoid
Using Fibonacci in Isolation: Always combine Fibonacci levels with other indicators or analysis methods for signal confirmation.
Ignoring Market Trends: Fibonacci Retracements are most effective for identifying market trends.
Overcomplicating with Too Many Levels: To avoid confusion, focus on the most critical ratio levels (e.g., 38.2%, 50%, 61.8%).
Conclusion
Fibonacci Retracements are an excellent tool for identifying key levels of support and resistance. Mastering them can strengthen trading plans, refine entry and exit points, and provide insights into how the market works.
Use Them The Right Way: Trade pairs and practice strategies on the MT4/MT5 platform with different markets. To enhance trading abilities, use Fibonacci Retracements and start making better moves.


