Table of contents:
- What is a Candlestick Pattern
- How Are Candlesticks Formed and How To Read Them?
- Bullish Candlestick Patterns
- Bearish Candlestick Patterns
- Pros and Cons of Candlestick Patterns
- Turn Knowledge into Action: Trade with ATFX
What is a Candlestick Pattern
A candlestick pattern is a strategy based on technical analysis that leverages historical price movements on charts to predict future price changes. Originating from techniques used by Japanese rice traders, these patterns have been trusted for decades to forecast market behaviour. They consist of one or more candlesticks, indicating whether the market will continue in the same direction, reverse, or remain stable.
Traders should familiarise themselves with various types of candlestick pattern or candlestick chart pattern and understand their potential impact on trading decisions in financial markets.
How Are Candlesticks Formed and How To Read Them?
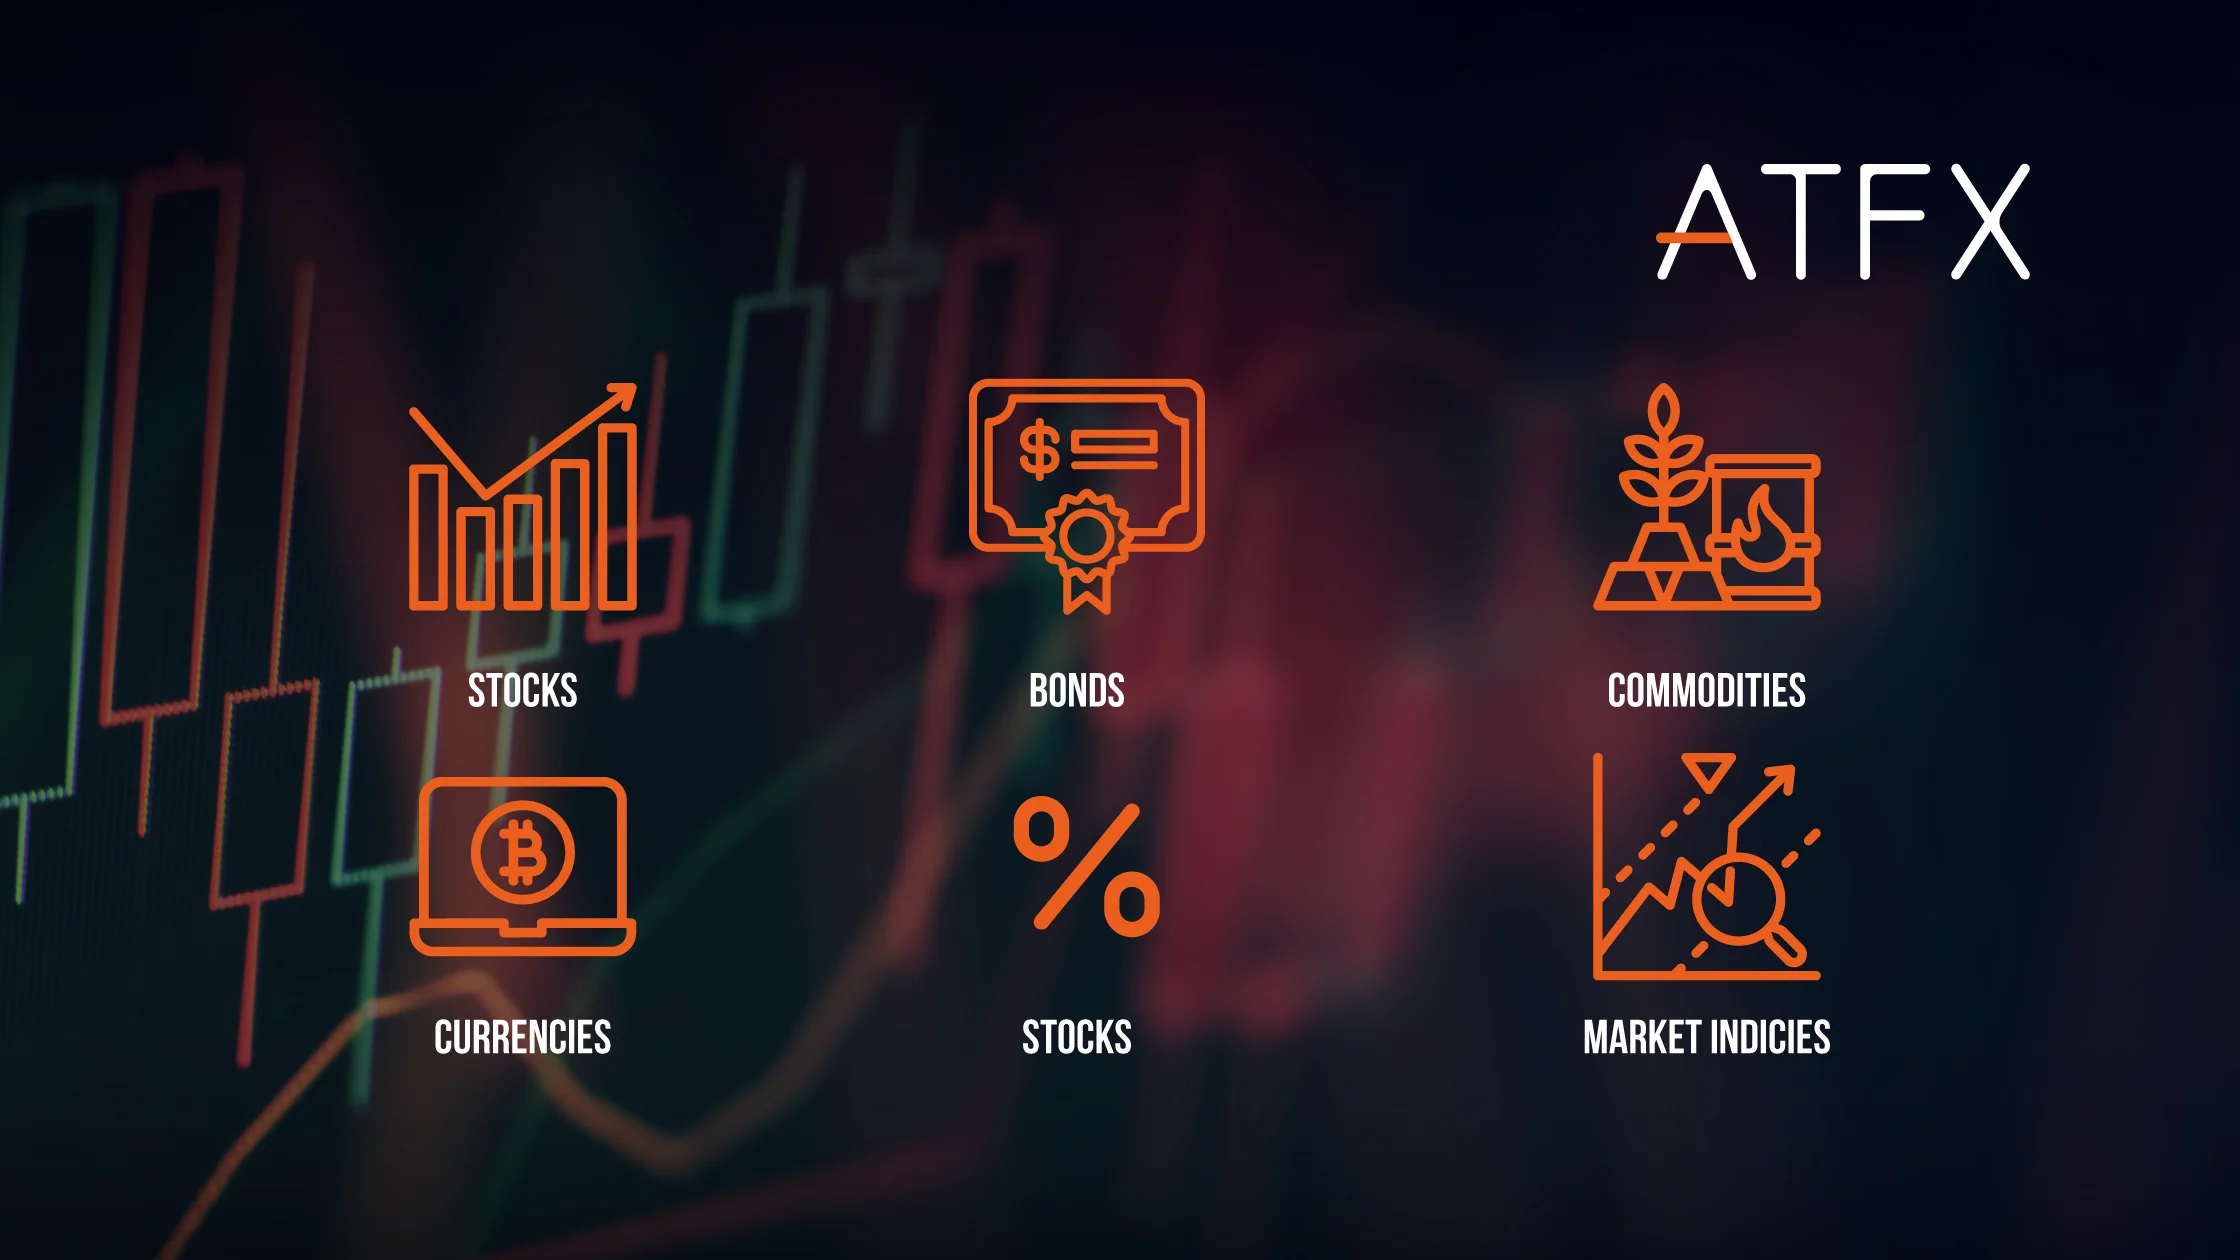
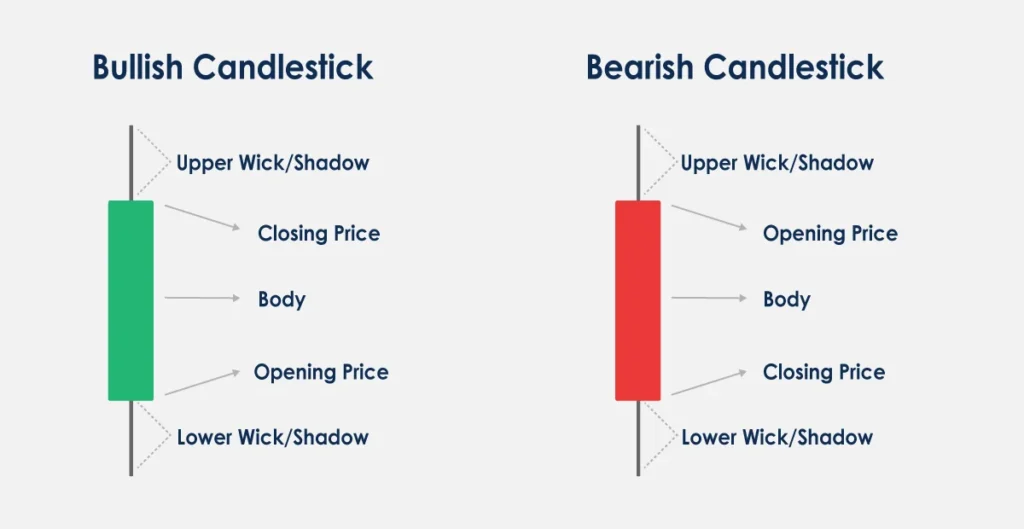
Each candlestick on a chart represents the price movements of various financial assets, including currencies, ETFs, stocks, indices, and commodities, over a specified time frame, which can range from minutes to weeks based on the trader’s preferences. Candlesticks are formed from the price movements of financial instruments, detailing the opening, highest, lowest, and closing prices for the selected period, such as 1 minute, 5 minutes, a day, a month, or a year. When traders mention “candlesticks” without additional context, they typically refer to traditional candlestick charts that emphasise these price movements. A candlestick comprises four key points: the open, high, low, and close of a trading session, providing a clear depiction of an asset’s price fluctuations over that period.
Each candlestick consists of a body and wicks. The body indicates the opening and closing prices, while the wicks represent the highest and lowest values reached during that time. Although trading volume is not part of the candlestick itself, it is often used alongside candlestick chart patterns to gain further insights into the strength and significance of price movements. CandleVolume charts, a specific type of candlestick chart, incorporate trading volume directly into the candlestick’s visual representation. Thus, interpreting a candlestick chart is a crucial skill for traders, as it provides valuable information about market sentiment and potential future price movements. When the closing price is higher than the opening price, the candlestick body is green, indicating a price increase. Conversely, if the closing price is lower than the opening price, the body is red, indicating a price decrease. Colours may vary by platform, but red and green are commonly used.
The vertical lines, or “wicks,” extending from the top and bottom of the body illustrate the highest and lowest prices during the trading session. Traders use candlestick patterns or candlestick chart patterns to identify market trends and cycles, which inform their trading strategies.
Learn how to read candlestick chart patterns for beginner
Bullish Candlestick Patterns
Bullish candlestick patterns suggest a potential rise in buying interest, indicating that the price is likely to increase. These patterns typically appear during or after a decline, signalling a shift in market sentiment from bearish to bullish candlestick pattern.
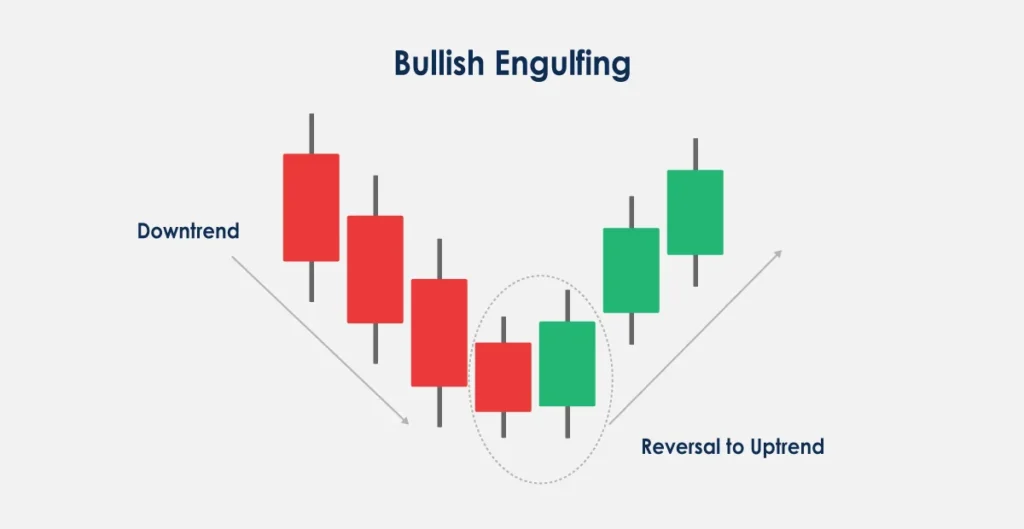
Bullish Engulfing
Bullish engulfing occurs when a giant green candle engulfs the smaller red candle from the previous session. It shows buyers have swamped sellers and may continue to drive prices upward.
This candlestick pattern is a strong bullish indication, particularly when it emerges following a long decline or around a support level. It shows a significant shift of momentum from sellers to buyers.
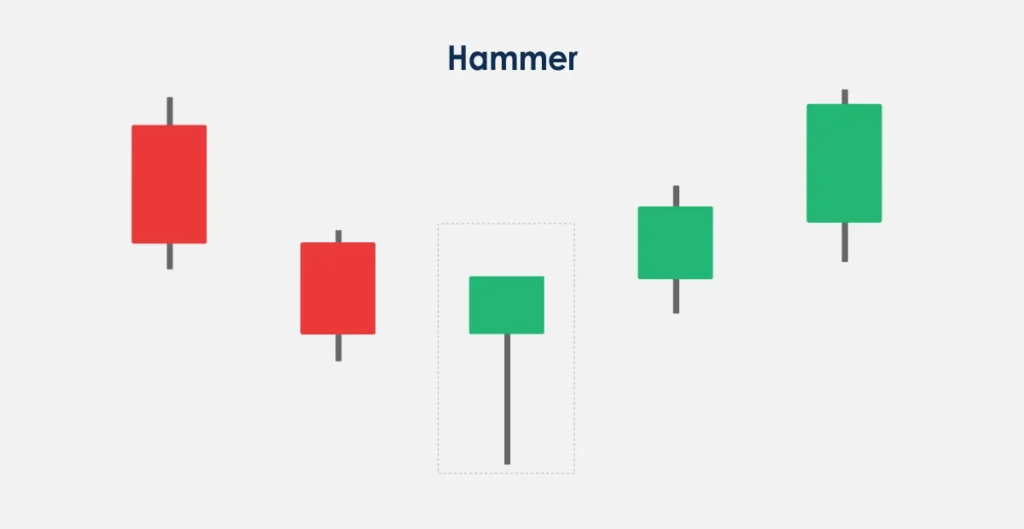
Hammer
The hammer is identified by a small body at the upper range with a long lower wick and little or no upper wick. It occurs during a decline, indicating a possible reversal or support level. It signifies that despite selling pressure, buyers managed to close the session near the opening level, showing strength.
Commonly viewed as a beacon of hope in a bearish market, the Hammer suggests that the market may be finding a bottom, with buyers starting to outnumber sellers.
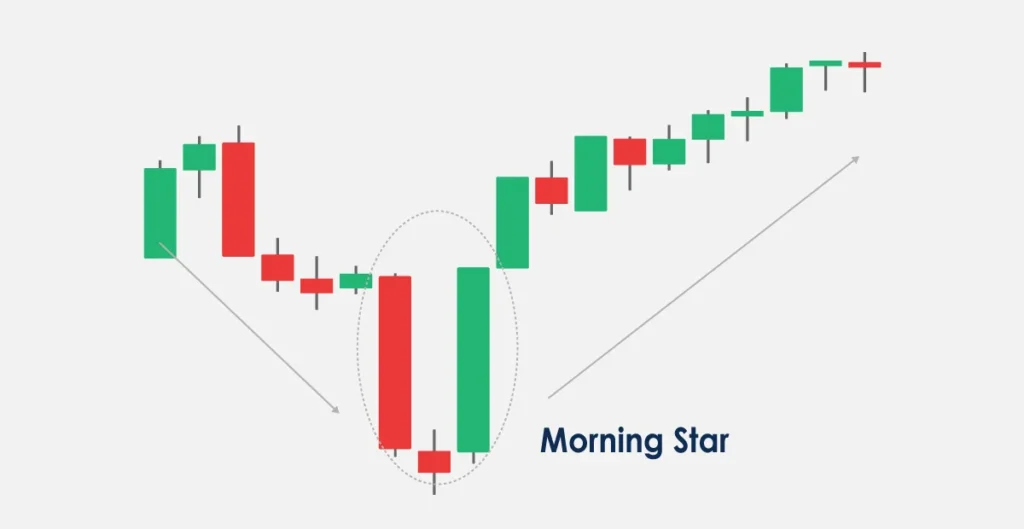
Morning Star
This three-candle pattern begins with a large red candle, followed by a small-bodied candle that gaps down and concludes with a large green candle that fits within the body of the first candle. This sequence indicates a shift in sentiment from bearish candlestick to bullish.
This pattern is particularly significant when the third candle erases the losses of the first candle, showing intense buying pressure and a potential change in market direction.
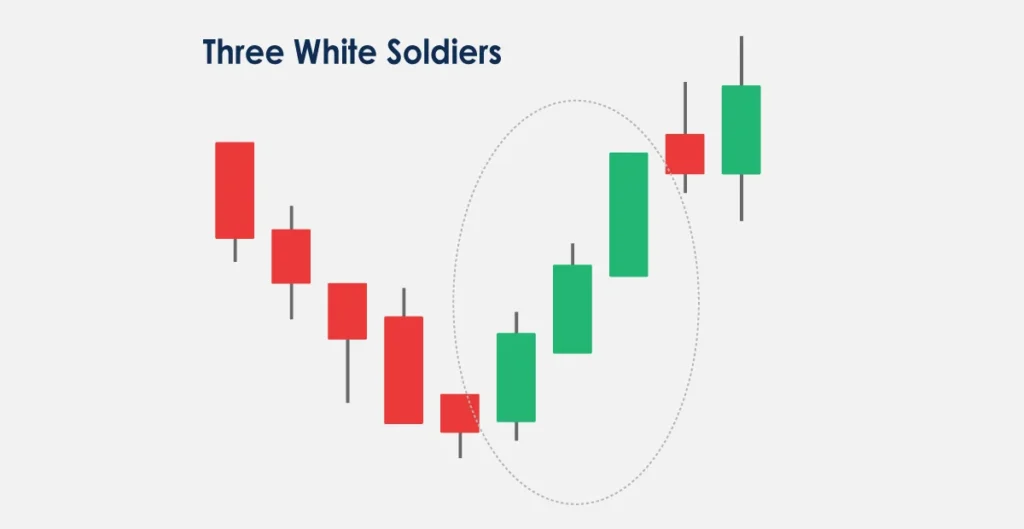
Three White Soldiers
Three white soldiers consist of three consecutive long green candles with small wicks, each session opens within the previous candle’s body and closes at a new high. This pattern indicates growing buying momentum and is seen as strongly bullish.
This pattern typically confirms a shift in momentum from bearish to bullish candlestick pattern. It is considered reliable when each candlestick opens progressively higher, indicating sustained buying pressure.
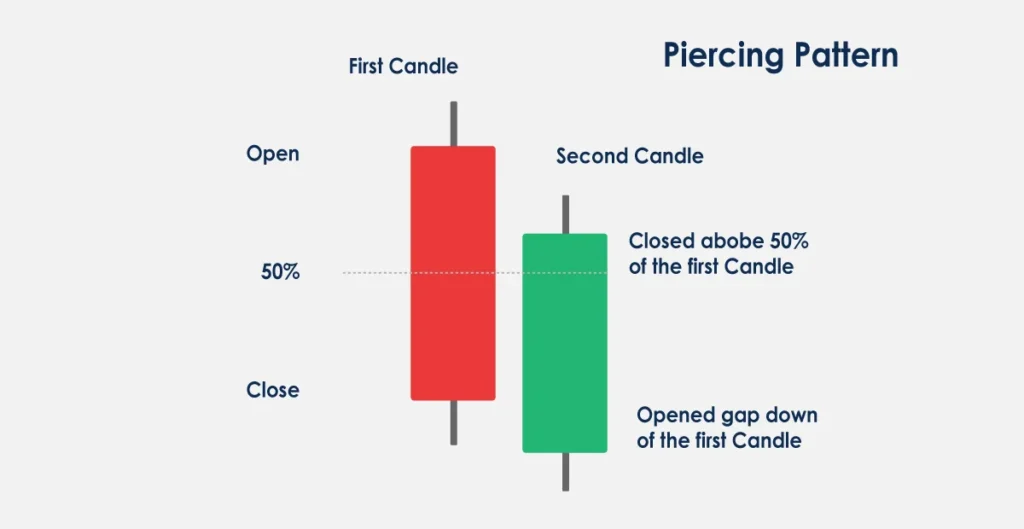
Piercing Line
This pattern consists of two candles in a downtrend: the first is a long red candle, and the second is a long green candle that starts at a new low but closes above the midpoint of the first candle. It suggests a potential bullish reversal.
The reversal implication of the Piercing Line is more potent if the second candle’s close is well into the first candle’s actual body. This shows a convincing comeback by the bulls.
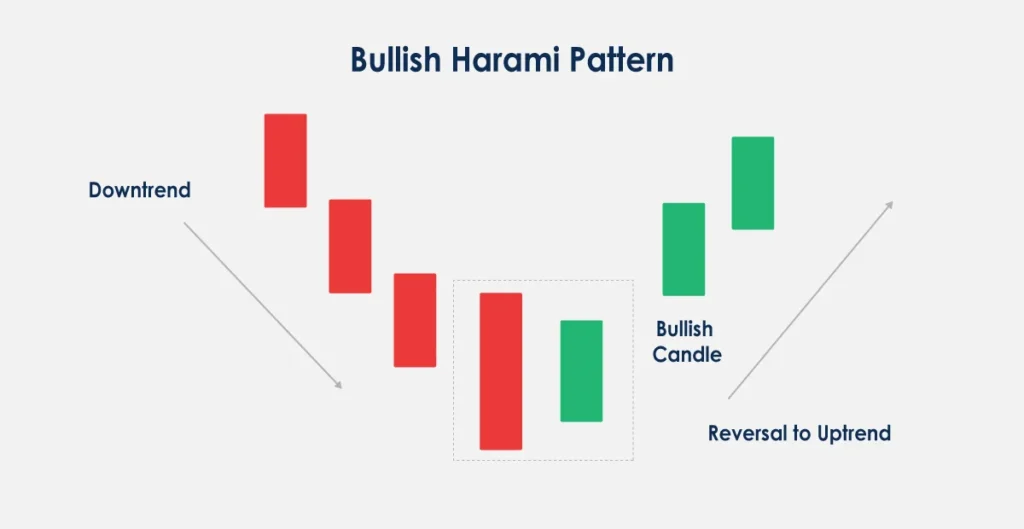
Bullish Harami
The Bullish Harami appears during a downtrend, where a large red candle is followed by a smaller green candle that is entirely contained within the vertical range of the previous red candle’s body. This formation indicates a potential reversal or a slowdown in bearish momentum.
This setup often suggests a pause in bearish momentum, with the potential for a bullish reversal if it is followed by higher closing prices.
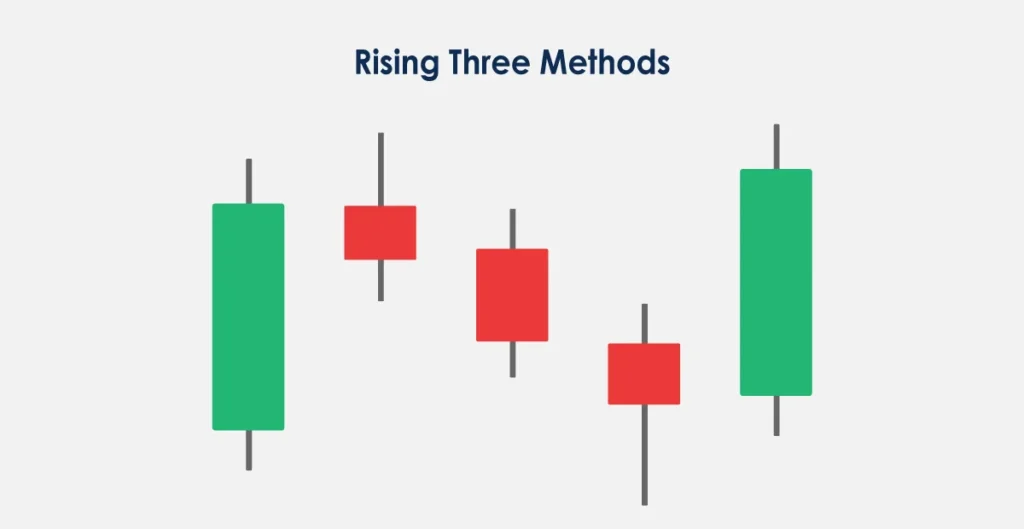
Rising Three Methods
The Rising Methods pattern begins with a long green candle, followed by three small-bodied candles that remain within the range of the first green candle and concludes with another long green candle. This pattern suggests the continuation of the current upward trend.
It indicates a “resting” phase in the market, with the bulls regaining dominance toward the end, signalling that the uptrend is likely to continue.
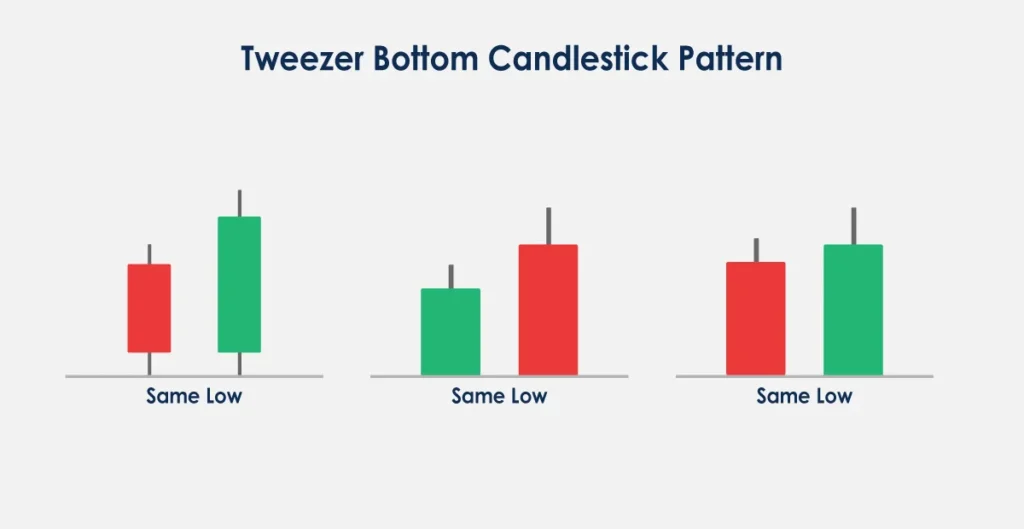
Tweezer Bottoms
Tweezer bottoms feature two consecutive candles with almost identical lows. It typically appears during a downtrend, suggesting a bullish reversal is imminent.
This pattern signifies a strong rejection of lower prices and can serve as an early indication of a bullish reversal, particularly following an extended downtrend.
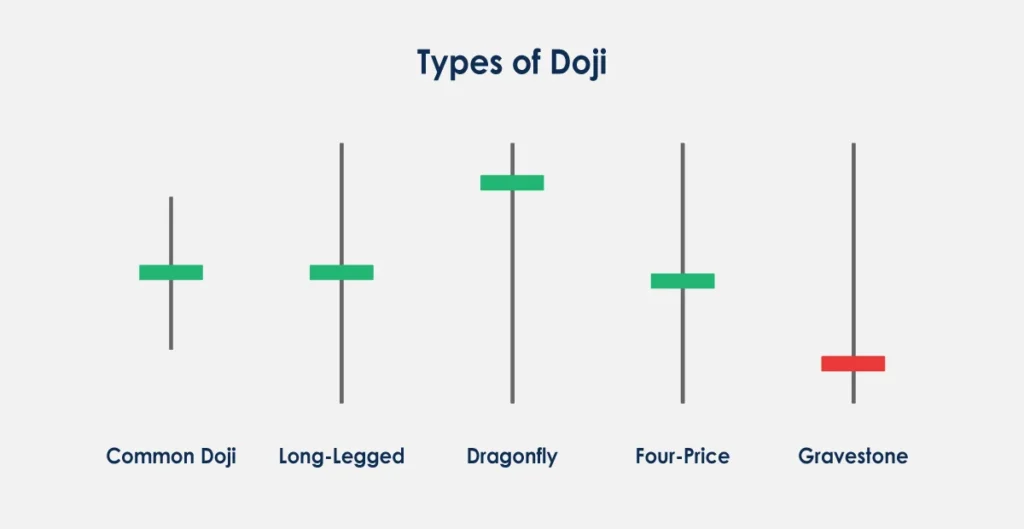
Doji
A Doji forms when a financial instrument’s opening and closing prices are virtually equal, resulting in a tiny body. The wicks can vary in length. This pattern indicates indecision in the market and can signal a potential reversal or continuation depending on the context in which it appears.
Doji patterns are particularly significant when found at the top or bottom of trends, suggesting potential reversal points as market sentiment shifts from bullish to bearish or vice versa.
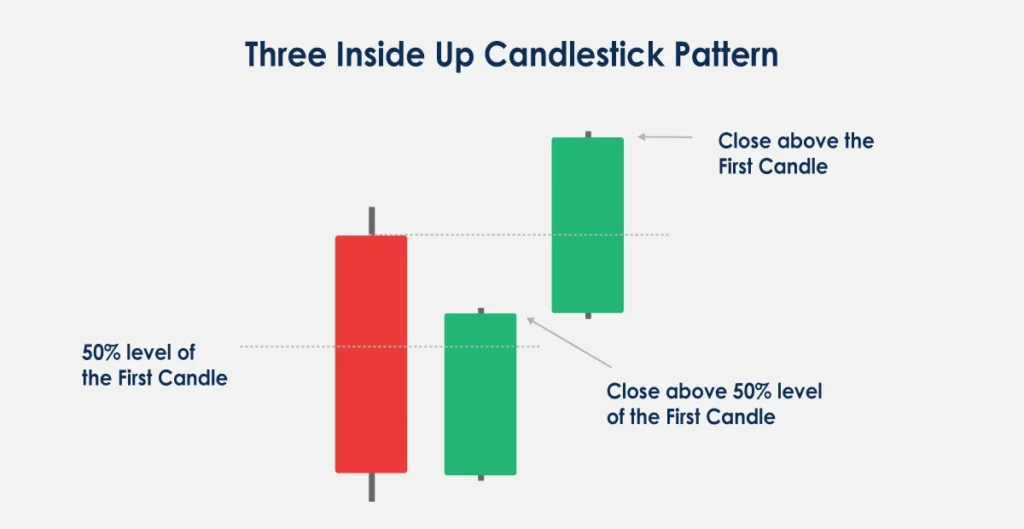
Three Inside Up
The Three Inside Up pattern starts with a large red candle, followed by a smaller green candle that closes within the body of the first candle. The third green candle closes above the peak of the first candle, confirming the pattern and indicating a potential reversal.
Bearish Candlestick Patterns
Bearish candlestick patterns indicate an increase in selling pressure, suggesting that prices may decline. These patterns often appear during or after an uptrend, signalling a shift from bullish to bearish sentiment.
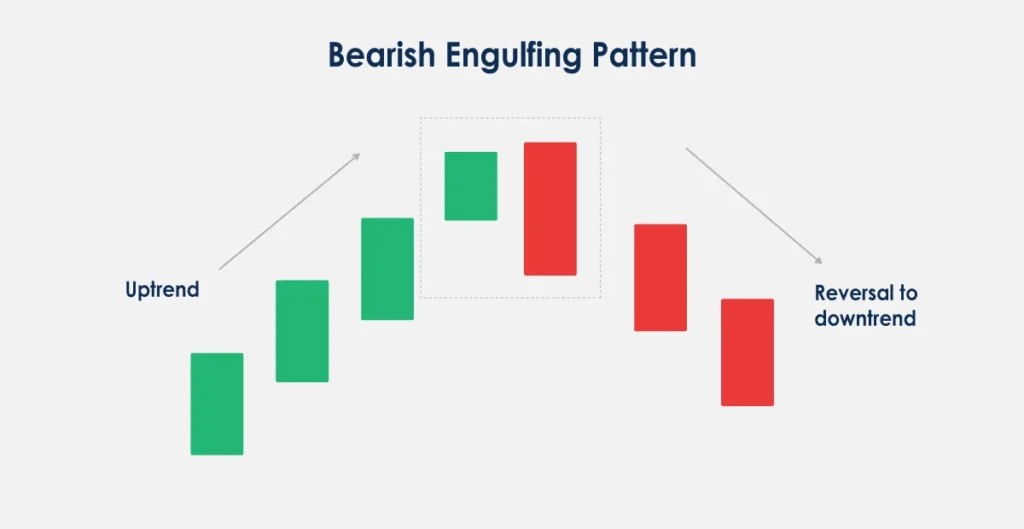
Bearish Engulfing
The Bearish Engulfing pattern forms when a large red candle (indicating a price decrease) completely engulfs the smaller green candle (indicating a price increase) from the previous day. This pattern suggests that sellers have overtaken buyers, potentially leading to further price declines.
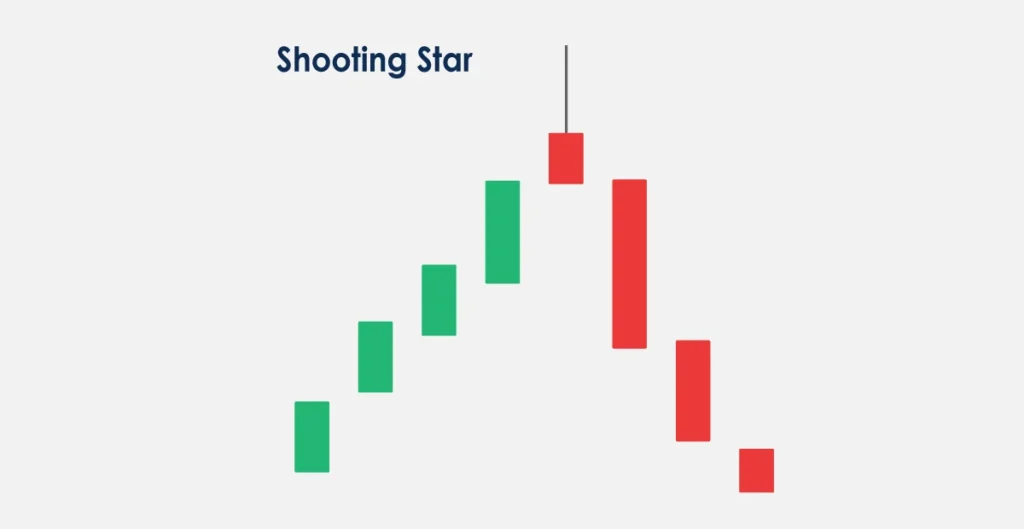
Shooting Star
The Shooting Star emerges following an upswing. It features a small body at the lower end of the trading range, a long upper wick, and little or no lower wick. It indicates that buyers attempted to push the price higher but were overwhelmed by sellers, driving the price back down.
The effectiveness of the Shooting Star pattern increases if the next candle closes below the Shooting Star’s close, confirming the bearish reversal.
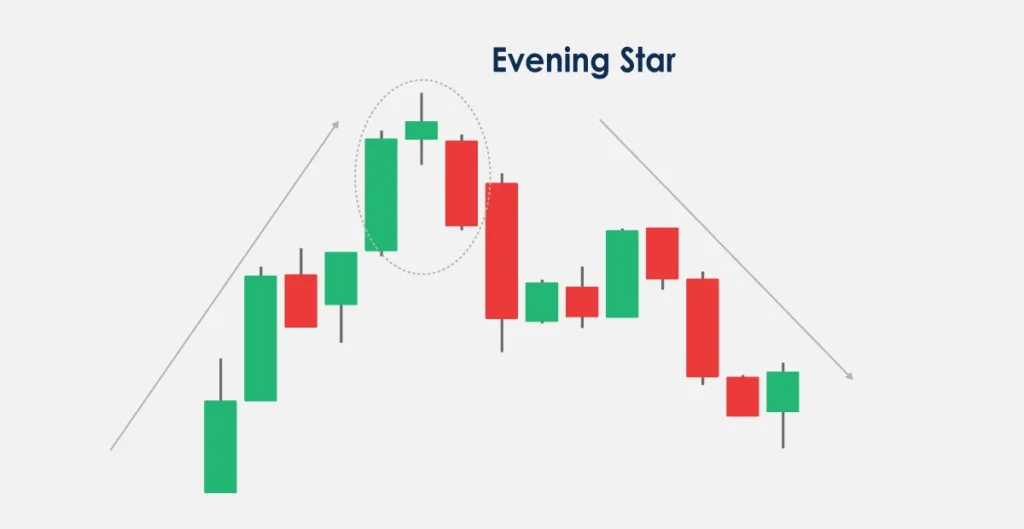
Evening Star
This three-candle pattern begins with a huge green candle, then a small-bodied candle that sits above the first. It culminates with a big red candle that closes within the body of the first candle.
This setup is a strong reversal pattern, especially when the third candle significantly erodes the gains of the first candle, indicating a surge in selling pressure.
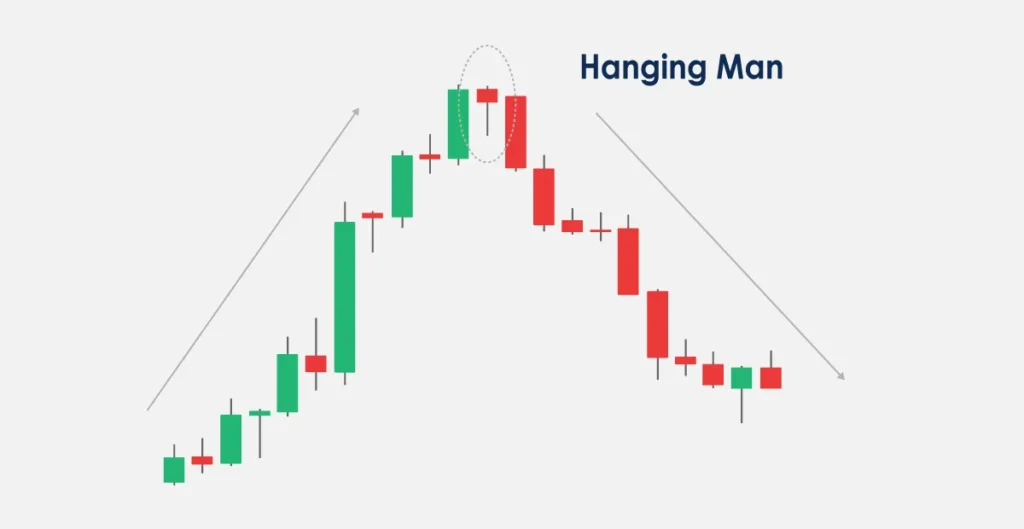
Hanging Man
This pattern resembles the hammer but occurs at the end of an uptrend. It features a small body with a long lower wick and indicates that selling pressure is starting to exceed buying pressure, warning of a potential reversal or significant decline.
The reliability of this pattern as a bearish signal increases if it is followed by a downward continuation, confirming that bears are in control.
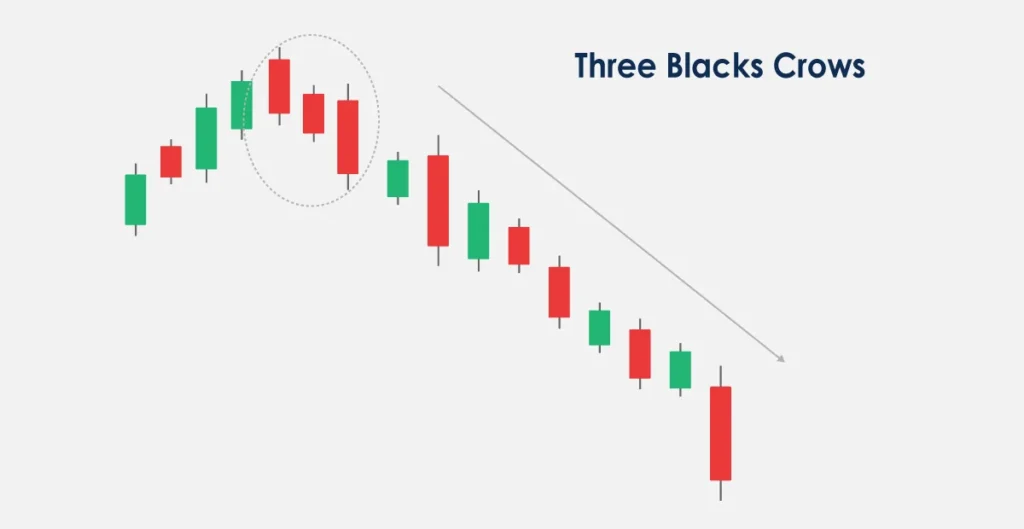
Three Black Crows
This pattern consists of three subsequent long red candles with short wicks, with each session closing at a lower position than the previous one. It indicates a significant downturn and bearish sentiments.
This pattern is a stark indication of bearish dominance, often prompting traders to exit long positions and potentially triggering a broader sell-off.
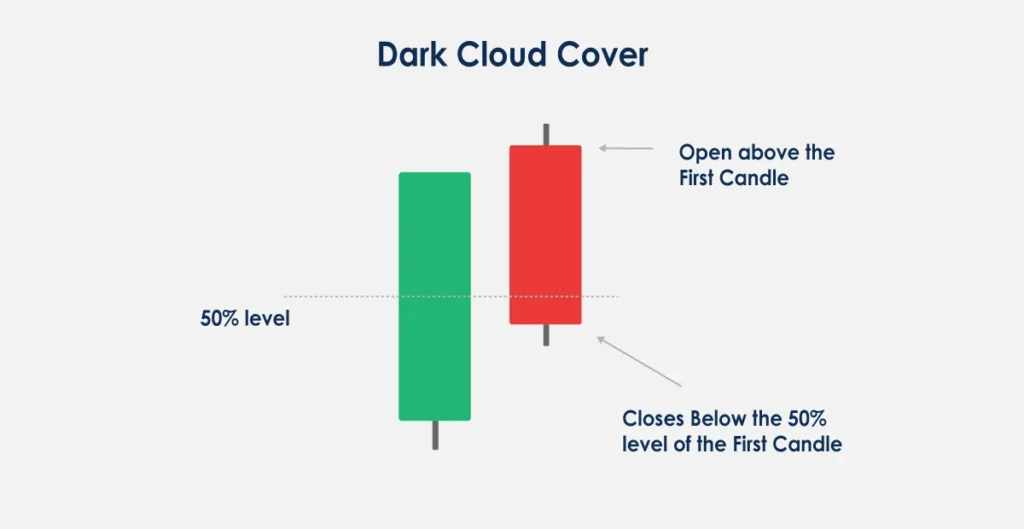
Dark Cloud Cover
This two-candle pattern starts with a long green candle, followed by a long red candle that opens higher but closes below the midpoint of the previous candle. This pattern strongly indicates a bearish reversal, particularly if the next candlestick shows further downward movement.
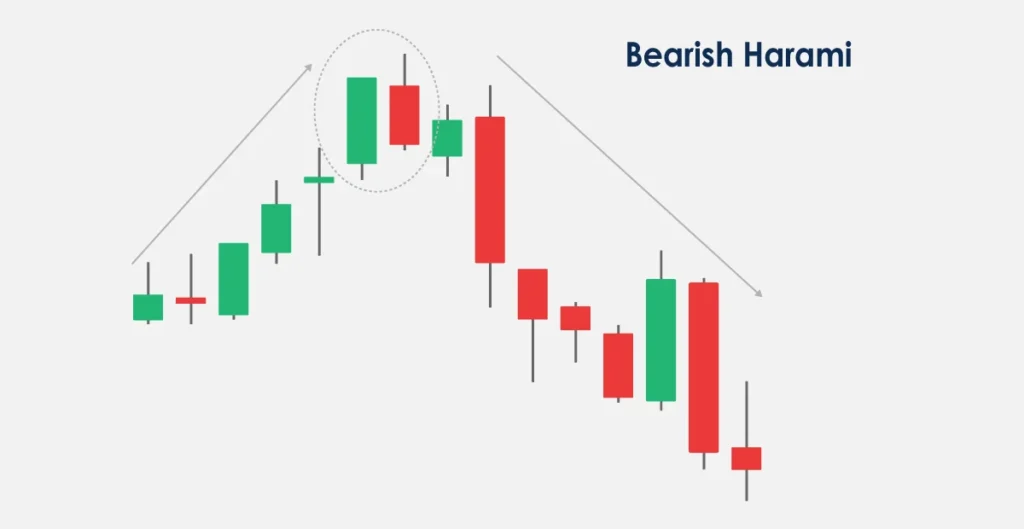
Bearish Harami
At the conclusion of an uptrend, this pattern unfolds with a large green candle succeeded by a smaller red candle entirely encompassed within the vertical range of the preceding body. It potentially signifies a decrease in bullish momentum and might foreshadow a bearish reversal, particularly if subsequent closes are lower.
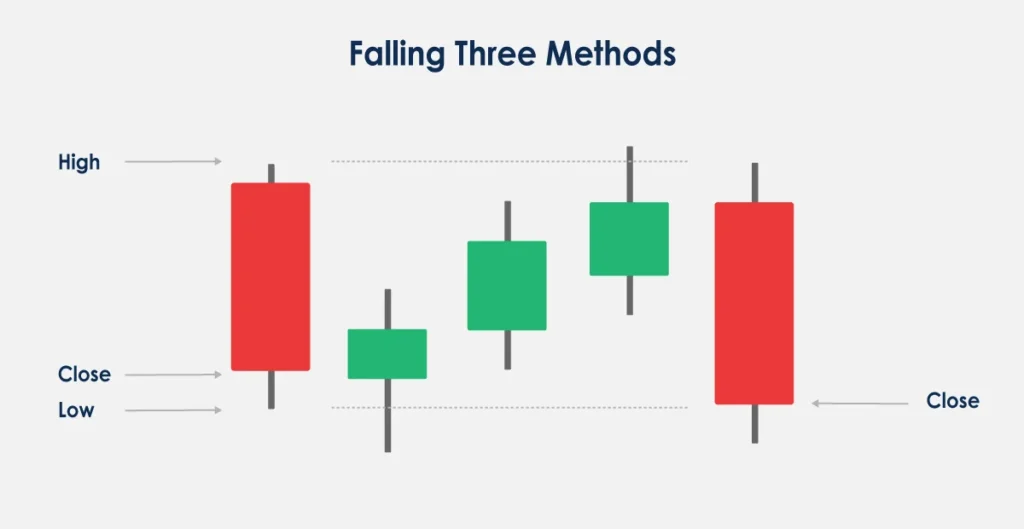
Falling Three Methods
The falling three methods begin with a long red candle, then three small-bodied candles within the range, and end with another large red candle. It is frequently noticed during a decline and indicates that, despite sporadic pauses, the overall bearish behaviour continues and is likely to go further.
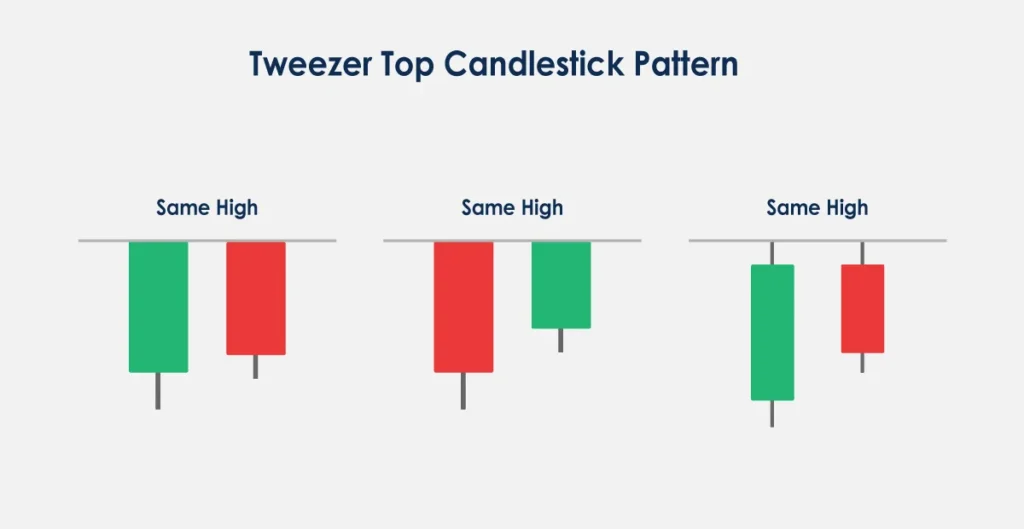
Tweezer Tops
Tweezer tops are defined by two subsequent candles that have almost similar highs. It often emerges following an upswing, signalling that a decline is about to begin.
This pattern clearly indicates a probable shift from bullish to bearish sentiment, primarily if it is supported by further bearish signs or dropping volume on the subsequent candles.
Find out how forex traders use candlestick charts to analyze trends
Pros and Cons of Candlestick Patterns
Candlestick patterns are widely used in technical analysis to forecast future price changes by examining historical market behaviour. Understanding the strengths and weaknesses of these patterns is crucial for effectively incorporating them into a comprehensive trading strategy.
Pros
Visual Clarity
A significant feature of candlestick charts is their ability to transmit complex pricing data in a simple visual format. Traders may quickly understand market sentiment, price movements, and volatility by studying candlesticks and their patterns.
Immediate Insights
Candlestick patterns provide quick insights into the market’s psychological state, helping traders determine whether buyers or sellers dominate the price movement. This is necessary for making rapid trading decisions.
Enhanced Trading Strategies
Traders often use candlestick patterns in conjunction with other technical analysis tools such as moving averages, RSI, and MACD to validate trade signals. This combination can enhance trading strategies and decision-making processes, leading to improved outcomes.
Predictive Power
Candlestick patterns are commonly employed to predict future market reversals or continuations. Patterns like the Bullish Engulfing and Bearish Harami can anticipate significant shifts in market trends, allowing traders to capitalise on potential upcoming movements.

Cons
Subjectivity
A notable challenge with candlestick patterns is their inherent subjectivity. Various traders may interpret the same patterns differently, and there can be ambiguity regarding what precisely defines a specific pattern. This variability can result in inconsistent trading decisions.
False Signals
However, candlestick patterns, like all technical indicators, can produce false signals. Market behaviour may deviate from the expected outcomes of these patterns due to unforeseen factors such as economic news, changes in market sentiment, or external events, potentially leading to trader losses.
Requires Experience
A trader needs a good amount of experience and knowledge to use candlestick patterns effectively. Without substantial practice, beginners might find it challenging to identify and act on the patterns.
Overreliance Risk
There is a risk of traders excessively relying on candlestick patterns while overlooking other critical elements of trading, such as fundamental analysis, market conditions, and news. This overdependence can result in inadequately informed trading decisions.
Turn Knowledge into Action: Trade with ATFX
Are you prepared to test your newfound knowledge of candlestick patterns? ATFX offers demo accounts and live trading accounts that are appropriate for your level of knowledge, whether you’re a beginner or an experienced trader. Execute what you have learned at zero risk with an ATFX demo account, or capitalise on your skills in the real market. Start your trading journey today with ATFX!