Crude Oil Prices & Investing
Everything to know about crude oil trading with suggestions on how to invest in crude oil under different market conditions.
In addition, explore usage of fundamental technical analysis, learn how historical prices chart out forecasts and identify factors that affect crude oil price movements.
In spite of enabling us to understand what is crude oil trading, the type of crude oil and substantial trading strategies to begin crude oil trading are explained. Information on should you invest in crude oil too can be acquired here.
WTI Crude Oil Price Live Chart
Brent Crude Oil Price Live Chart
How to Invest in Crude Oil Trading?
3 steps to Investing in Crude Oil
Step 1: Download Metatrader 4
Getting familiar with crude oil trading via a demo account allows a virtual experience without risking capital on Metatrader 4, also known as MT4, the world’s most popular trading platform amongst traders and gaining access to a wide product range such as indices, currencies, shares and commodities.
Step 2: Open Demo Account
Start trading crude oil & Open Demo Trading account with ATFX, a globally regulated broker that’s been ranked 3rd on Finance Magnates’ largest retail broker list based upon traded volume on the MT4 trading platform. Invest in crude oil trading commodities today and join in the action of crude oil investing.
Step 3: Begin Crude Oil Trading
The traditional method of investing in crude oil is to enter the market with a crude oil trading account and buy a derivative product such as options, futures, or through an exchange-traded product like ETFs for Brent Crude Oils and West Texas Intermediate Crude oil (WTI).
How to Trade Crude Oil?
Trade crude oil through:
Futures: Predicting oil price movements in the future
Spot: Trading the current market price for oil
ETFs: Tracking the performance of oil through exchange-traded futures contracts
Options: Taking opportunities with active volatility
Single stocks: Gain an advantage by taking a long or short position on oil companies
Stocks: Buying shares or going long or short on oil companies & receiving dividends in return.
What is Crude Oil?
Crude Oil Definition:
Crude oil is defined as a mixture of hydrocarbons that exists in liquid form found in underground reservoirs, otherwise known as petroleum. Due to the atmospheric pressure during this particular phase, it remains in liquid state after extraction. Apart from electricity and heating, crude oil is vital for transportation that involves a combustion engine, along with an array of oil-inclusive products.
Our modern world has become increasingly dependent on oil as it’s primary source of energy production and the liquidity it generates. Commonly referred to as “black gold”, crude oil can be used for anything made with plastic because it sits at the very base level.
Investors tend to trade in oil because it has an attractive dividend income along with high volatility and share price appreciation.
Types of Crude Oil
4 types of crude oil.
1.Very light
Includes gasoline, jet fuel & petroleum, evaporates quickly.
2.Light
Typically used for fuel oils, considered volatile and toxic.
3.Medium
Most used due to low volatility and high viscosity.
4.Heavy
Heaviest & most viscous type.
World's benchmark for crude oil prices
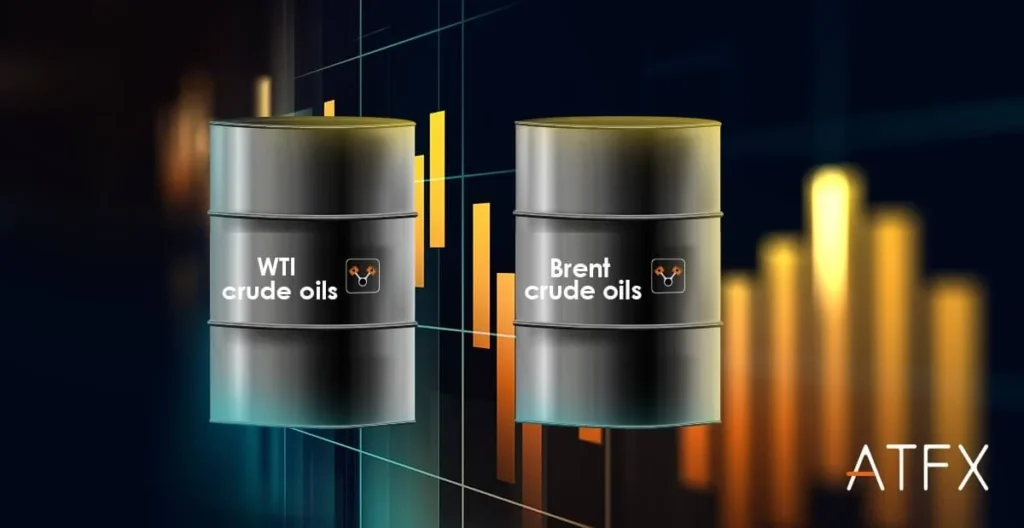
WTI crude oils
Typically group with the lighter kind of oils that are heavily used in gasoline production. It is extracted and produced in the United States.
Brent crude oils
Refined in Northwestern Europe, and primarily used across Europe and Africa.
Crude oil price fluctuations are largely attributed to decisions made by the Organization of Petroleum Exporting Countries (OPEC) relating to levels of production. Political tension too tends to increase the volatility of oil prices.
Another key market moving factor for prices are crude stockpiles, played out by weekly investor speculation which eventually forms the equilibrium between supply and demand. In cases whereby this becomes non-existent, an excess in supply occurs and a fall in crude oil prices is observed.
Crude Oil Price Forecast
Looking at Goldman Sachs projected rise for crude oil prices with forecasts reading up to $90, gas prices do indeed shoot up over increased demand and lowered supply.
Oil prices jumped over 80% in 2021, and whilst Brent Oil heads towards the $90 level it is currently above the $80 mark, hitting its peak since 2014. As the price of Oil surges, the American Petroleum Institute(API) and Energy Information Administration(EIA) have been reporting significant draws in U.S. crude oil with stockpiles hovering near 3-year lows.
Investor behavior towards crude oil prices is considered bullish throughout these several months, especially from Goldman Sachs’ financial year projection which revealed upsoar to $90 per barrel of crude oil. In hindsight, the most significant force that speared up the prices of oil during this period in fact was due to increment of airfares along with a less than average performing economic outlook.
Bank of America’s forecast read that global crude oil could hit $100 per barrel come 2022 resulting from rebound travel. This surpasses expectations set by Goldman Sachs who prepared the mid-year forecast based on the price of $80, which before had similarly been accurately predicted using historical crude oil prices.
Output disruption might be able to correct crude oil prices over the long term, yet this notion is subjected to the willingness of OPEC+ to remove sanctions previously placed on Iran. Bank of America cautioned about the reemergence of Iranian oil barrels in markets due to a potential pull back driving oil prices down from the clouds.
Crude Oil Technical Analysis
To provide some context for critical technical analysis performed on crude oil trading, prices were observed to reach a three-year peak weeks earlier, due to preceding output disruptions that included two hurricanes in the U.S. driving its crude oil stockpile levels to near a 3-year low. These are in addition to large banks producing bullish forecasts upon the primed commodity.
The crude oil trading market has been seeing an uptrend throughout 2021, creating concerns amongst investors of an oncoming inflation. By observing the chart below on Brent (daily frame), Brent has surpassed $80 in such a short amount of time signifying intense volatility.
Brent (daily frame)
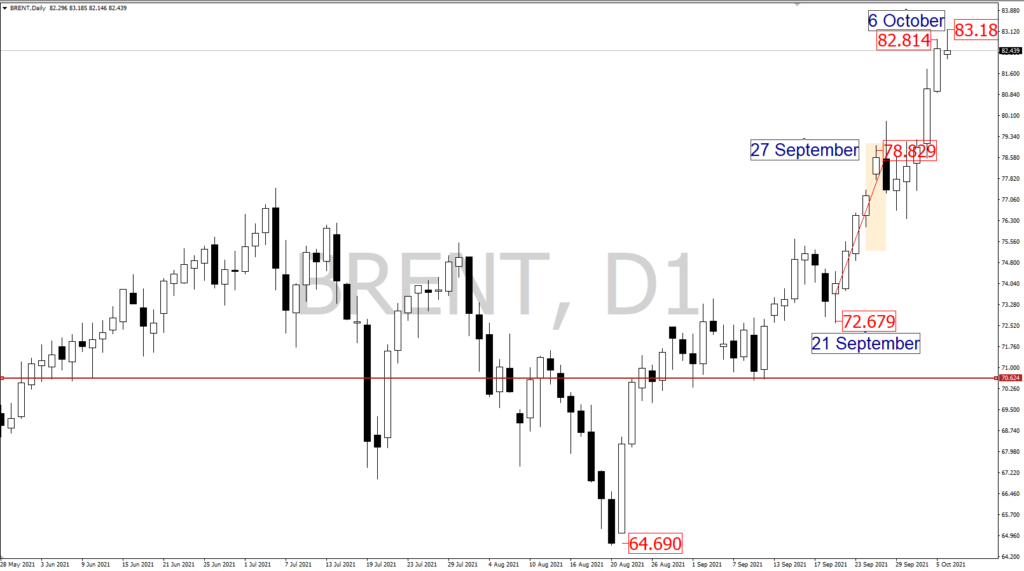
Crude oil has been following an uptrend since the start of the year, creating worrying investors of inflation fears. As you can see in the chart provided on Brent (daily frame), Brent has surpassed $80 in such a short amount of time signifying intense volatility with a target of 81 resistance.
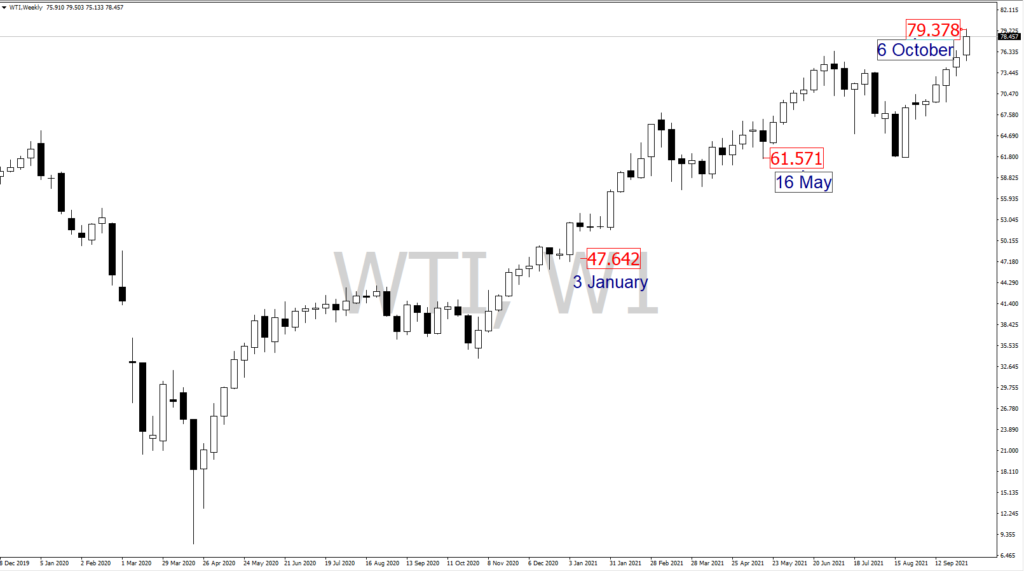
WTI weekly chart
Arguably, OPEC’s latest decision to increase output to 400,000 bpd in the second quarter pressured oil prices towards a downtrend. However, OPEC’s response by maintaining a similar strategy for output at 400,000 bpd kept crude oil prices elevated.
Historical Crude Oil Prices
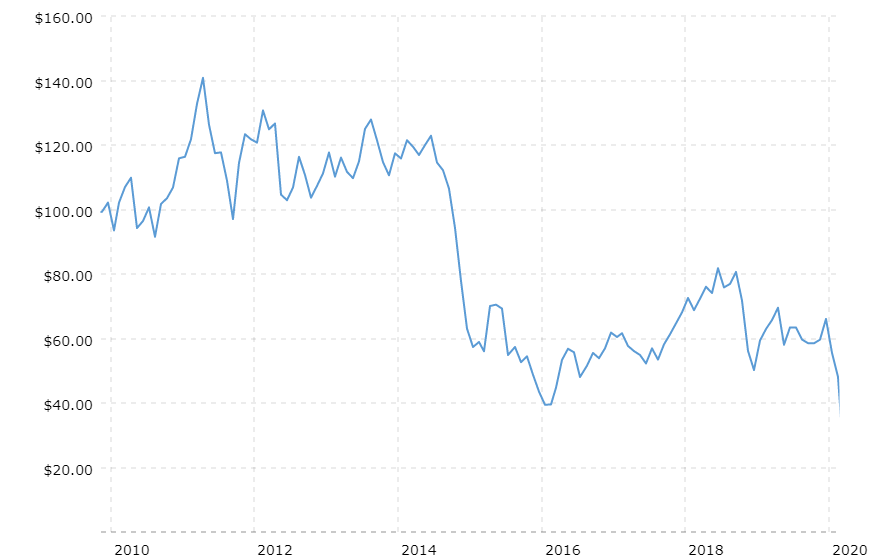
Crude Oil Prices - Historical Annual Data
| Year | Average Closing Price | Year Open | Year High | Year Low | Year Close | Annual % Change |
|---|---|---|---|---|---|---|
| 2020 | $39.68 | $61.17 | $63.27 | $11.26 | $48.52 | -20.64% |
| 2019 | $56.99 | $46.31 | $66.24 | $46.31 | $61.14 | 35.42% |
| 2018 | $65.23 | $60.37 | $77.41 | $44.48 | $45.15 | -25.32% |
| 2017 | $50.80 | $52.36 | $60.46 | $42.48 | $60.46 | 12.48% |
| 2016 | $43.29 | $36.81 | $54.01 | $26.19 | $53.75 | 44.76% |
| 2015 | $48.66 | $52.72 | $61.36 | $34.55 | $37.13 | -30.53% |
| 2014 | $93.17 | $95.14 | $107.95 | $53.45 | $53.45 | -45.55% |
| 2013 | $97.98 | $93.14 | $110.62 | $86.65 | $98.17 | 6.90% |
| 2012 | $94.05 | $102.96 | $109.39 | $77.72 | $91.83 | -7.08% |
| 2011 | $94.88 | $91.59 | $113.39 | $75.40 | $98.83 | 8.15% |
| 2010 | $79.48 | $81.52 | $91.48 | $64.78 | $91.38 | 15.10% |
To identify an accurate direction to any asset or commodity, we need to look at the assets historical pattern, in this guide we need to skim through oil price history to assess the capability for it to follow the uptrend it is expected to follow.
Historical charts are very valuable to technical analysis, because financial instruments and commodities tend to follow patterns on the chart through past price action. However its reliability may vary due to frequent updates provided by market news reports. Certainly they are measurable and they will give you an idea of where markets could be heading. Traders use historical patterns to identify entry and exit signals.
The more used you get with past price patterns, the better you will be at spotting them as they happen again. Historical price patterns affect the current price action, they show you areas where breakouts happened in the past and if markets are truly bullish or bearish. Making trade decisions can be hard and your psychological state is actually on the list for risk management, so historical patterns can boost your confidence and give you an idea of where to start.
What affects Crude Oil Price Movements?
5 external price factors in crude oil trading
Geopolitics
Supply and demand
With higher demand, the price for oil should increase and if supply exceeds the market demand prices should go down.
Referring to the example of the weekly American Petroleum institute figure, a draw in crude stockpiles will keep oil prices elevated but an unexpected increase will cause oil prices to drop. Along with weather disruptions that affect the oil stockpiles and refineries output, it is also a factor for volatility in oil markets.

OPEC
Market sentiment
Consumer consumption
Affecting demand therefore it is a defining factor for oil prices. If you notice that at times of summer and winter holidays, oil prices usually go up due to increased drives in the summer and increased travel for the Christmas holidays.
Is Crude Oil a Good Investment?
Crude oil is attractive to both day and long term traders, as the energy sector in global financial markets carries heavy liquidity and volatility. Hence allowing traders to take advantage of different opportunities. And despite demand fluctuations, it has a high profitability rate.
There are also different varieties of this particular industry to invest in, for instance you have the choice of refinery companies, exploration or drilling and distributing companies. Oil is also a primary source of energy and will continue to be useful long term.

Crude Oil Trading Strategies - Beginner & Professional Traders
Day trading
Swing trading

Trend trading strategy
Trend trading is designed to follow the direction of an asset, when the price moves in one overall direction, either up or down. Through apparent uptrends or downtrends, a trader can take advantage of new highs or new lows in a downtrend. This strategy involves technical analysis to define a trend. Trend traders enter a trade when there is a predetermined trend for analyzing specific markets including oil.
Position trading
Position trading is when traders hold long term positions of a security, usually throughout months or even years. It’s a strategy more suitable to a bull market defined by strong trends, looking for successive higher highs or lower highs to determine a trend. Position traders see long-term trends as more profitable. It is typically done by using technical and fundamental analysis, relying on global market trends and historical patterns.
Click here for the full trading strategies guide
Why Trade Crude Oil with ATFX?
An Industry Essential
Strategic Position
Enormous Trading Volume
Crude Oil’s History
Start Crude Oil Trading in 3 Simple Steps
Register for an account
Open your account
Complete the Live Trading Account application form. Once we have verified identity, we will set up your account.
Fund your account
Start trading
FAQ
US Oil (WTI)
UK Oil (Brent)
Saudi Arabia, USA, Russia, Canada and China
You can buy options and futures through a commodities exchange or buy shares of an oil ETF. You can also buy shares of oil companies.
Crude oil is a primary energy and fuel resource. Industries such as plastic manufacturers, airlines and agricultural type businesses rely heavily on crude oil.
A barrel contains 42 gallons of crude oil
A barrel holds 159 litres of crude oil.
You can buy options and futures through a commodities exchange or buy shares of an oil ETF. You can buy shares of oil companies through a brokerage as well.
OPEC outlines oil production targets and quotas for its members, which translates into a major influence on oil prices.
Crude oil is the main component used to produce gasoline, hence it is able to control the prices of gasoline from behind.
Timings differ according to product and the type of contract, be it a spot rate or futures contract. You can find the timings on Metatrader 4(MT4) by Right-Clicking on the product, eg. ‘WTI’, and then Left-Click to select ‘Specifications’.
To illustrate:(based on MT4 server time)
Brent contract trade timings : 03:01-23:59 (Friday 23:55)
WTI contract trade timings: 01:01-23:59
WTI Futures: 01:01-23:59
Just like gold, crude oil is very expensive and has a high value. It is extracted underground from the soil and is black in colour.
- WTI Crude Oil Price Live Chart
- Brent Crude Oil Price Live Chart
- How to Invest in Crude Oil Trading?
- How to Trade Crude Oil?
- What is Crude Oil?
- Types of Crude Oil
- Crude Oil Price Forecast
- Crude Oil Technical Analysis
- Historical Crude Oil Prices
- What affects Crude Oil Price Movements?
- Is Crude Oil a Good Investment?
- Crude Oil Trading Strategies – Beginner & Professional Traders
- Why Trade Crude Oil with ATFX?
- Start Crude Oil Trading in 3 Simple Steps
- FAQ